Measuring Health of User-Developed Code
Exploring Code Health in a Corpus of Jupyter Notebooks
Abstract
Systems that support user-developed code are faced with a key challenge: understanding the health of that code, which we define as the expectation that existing code will function properly in the current environment. The growing popularity of Jupyter notebooks has led to the development of publishing and execution platforms such as the open-source nbgallery project. Users of nbgallery would like to understand when they can expect a notebook to work, and notebook authors may wish to monitor the execution of their code and be informed of errors. This paper describes our initial efforts to measure code health in a corpus of notebooks within an instance of nbgallery. Our vision is that this work will help address problems that arise from user-developed code and motivate further study in systems beyond Jupyter and nbgallery.
Background
Many systems enable users to submit their own code for storage and execution. In the most basic examples, the system merely stores the code for public sharing and collaboration. In more complex systems, user-developed code may be incorporated into the live system and executed on the fly, perhaps in a sandbox. Some simple examples include GitHub, which provides public and private code repositories, and PyPI, the public repository of open-source python packages. Mobile apps and browser extensions are notable examples in which user-developed code is executed on the platform. The Notebook Gallery (nbgallery) stores Jupyter notebooks that can be launched in a user’s personal compute environment or in a multi-user system like Jupyter Hub.
Systems like these face challenges related to the health of code submitted by users. We define code health loosely to mean the degree to which a user can expect a piece of code hosted in the system to work properly in the current environment. For example, a git repository or python package is healthy if a user can download it and it works “out of the box.” A browser extension might be considered healthy if its basic functionality works without impacting the browser’s performance. A Jupyter notebook is healthy if a user can execute it and get results as expected.
Our use case with nbgallery involves thousands of notebooks shared among a geographically dispersed enterprise userbase. Rather than relying on shared static data sets, the majority of these notebooks dynamically retrieve data from external sources that employ row-level security. This makes it difficult to perform static code testing, as a notebook’s input may vary from day to day and user to user.
Additionally, a primary goal of our effort is to empower “citizen” data scientists, or those who have the aptitude, curiosity, and creativity to explore data but lack the background of a traditional software developer or data scientist. In doing so, we want to provide the ability to search for and discover snippets of code for re-use in new notebooks and while minimizing the propagation of unhealthy code segments.
Broken code is obviously a problem, but working code may also “rot” over time as dependencies and APIs change. Containerization and various language-specific tools can help snapshot the software dependencies of the code, but many of our notebooks acquire data from external services whose APIs evolve over time. Unhealthy code may not be a problem for simple storage systems – if the code in a public git repository no longer works, it may not affect anything beyond frustrating potential users. However, in systems that actually execute user-developed code, unhealthy code can be a major problem that impacts the performance of the overall system. It may also lead to duplication as users fork existing code to make small changes or just for the sake of having their own copy. If the amount of unhealthy code becomes too large, users may lose confidence in the system.
With our experience as both users and developers of such systems, the nbgallery team decided to explore possible solutions to the problem. Jupyter notebooks are an ideal form of software to investigate code health. They contain a relatively small amount of code and are generally executed linearly from start to finish. They are also subdivided into manageable units (code cells) that can be evaluated separately from the notebook itself. The Jupyter software itself is highly extensible, enabling us to gather live data from users to assess the health of the notebooks being executed.
Related topics
We were unable to find any previous work that exactly lines up with our goal of measuring code health (as we define it) from runtime execution data. However, there are several related topics worth mentioning.
Software testing and code coverage
Automated testing helps ensure that a software product functions correctly. Common techniques include unit testing (small pieces generate correct output), integration testing (pieces work together properly), and regression testing (new features don’t break old features). Code coverage describes the proportion of a codebase that gets exercised during automated testing. This is very similar to our goal of measuring health – a robust test suite with high coverage makes a strong statement about the health of the codebase. However, our particular use case is not well-suited for automated tests:
- Jupyter notebooks are not ideal for formal testing methods, although some work has been done in the Jupyter community to make it easier.
- Many of our notebook authors are not traditional software developers and likely have little interest in writing tests.
- Our data security rules prevent “real” data from being captured in test suites, so authors would have to generate notional data.
- Automated tests typically have pre-defined inputs with expected outputs, while many of our notebooks process datasets that are obtained from external sources and may change over time or in response to user-specified parameters.
This last point is of particular importance to us – a healthy notebook should work regardless of query parameters that may vary greatly for users in different organizations.
Software profiling
Profilers use various techniques to measure software performance during execution. As with software testing, this is very similar to our goal of measuring health. The major difference is that profiling usually measures time or space performance to help inform optimization, while we hope to measure “success” of execution, which is harder to define in a generic way.
One common profiling technique is to instrument code with additional instructions to record performance data. We ultimately took a similar approach with Jupyter notebooks to record execution data.
Static software metrics
Various metrics can be computed statically from source code, ranging from simple things like lines of code or function length to more sophisticated assessments of complexity or maintainability. Software with good scores on these metrics tend to have fewer defects. For our purposes, though, we see these more as risk factors – it’s entirely possible that an “ugly” notebook is perfectly healthy.
Software defect research
There have been numerous studies of software defects, including root cause analysis and evaluating strategies for reducing their occurrence. Of particular relevance here is software defect prediction, in which software metrics are used to predict the occurrence of defects, with ground truth derived from either runtime fault data or bug tracking systems. Again, using static metrics is not ideal for our purposes, but this is an interesting area for future work.
Code similarity
Code similarity is less related to code health, but duplication of code can be a side effect from a lack of information about code health. There has been quite a bit of research into detecting plagiarism of code in academic settings. The Lab41 Altair project investigated code vectorization and deep learning strategies for identifying code with semantic similarities.
Methodology
Implementation
We drew inspiration from Lab41’s Ganymede, which is a server-side Jupyter extension that logs the input and output of each cell during execution. However, Ganymede did not meet our needs for a couple of reasons. First, we want to log execution data to nbgallery using the credentials of the user executing the notebook, and the Jupyter server does not (and should not) have access to those credentials. Second, the data security rules in our environment prevent us from logging full input and output, which may contain restricted data.
Instead, we developed a client-side Jupyter extension that instruments the cell execution action in Jupyter. Because the client-side extension runs in the user’s web browser, we can use AJAX to post data to nbgallery with the user’s credentials. After the user executes a cell, we determine success or failure depending on whether an exception was thrown (specifically, whether any of the cell outputs are of type error). If the notebook is linked to nbgallery, we post an execution log to nbgallery containing the notebook id, the MD5 hash of the cell’s code, the execution runtime, and the success value.
On the nbgallery server side, we create an entry in the database for each code cell when a notebook is uploaded. When an execution log is received from a Jupyter instance, the notebook id and code hash are used to look up the code cell entry in the database and store the log along with the user id and the current time. If the code hash isn’t found, the log is discarded – this could mean the user modified the cell before running it or doesn’t have the latest version of the notebook. If the notebook’s author uploads a new version, all the execution logs for that notebook are deleted and the database entries are recreated based on the new code.
Figure 1 shows a sample execution profile displaying the number of successful and failed executions for each cell in a notebook.
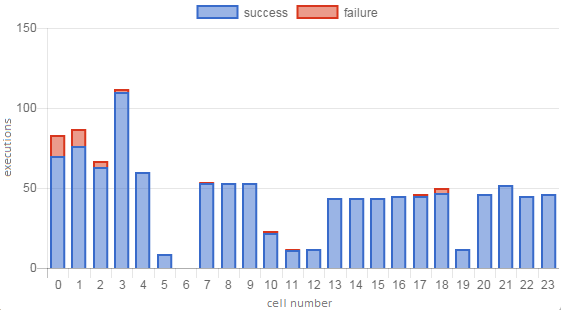
Figure 1. Sample notebook execution profile.
Our values
When evaluating the health of a notebook, we decided that several things are important:
- The health of the individual cells within the notebook. A notebook is obviously not healthy if many of the cells fail most of the time.
- How far users make it into the notebook. Does an error prevent them from making it all the way to the end, or are they able to power through?
- How many users have run a notebook, and how many times. This gives us confidence that it’s working (or not) consistently for multiple people.
- Recent executions. If nobody has executed a notebook in the last six months, we have less confidence that it will work now.
In some sense, we don’t care about minor bugs as long as they don’t affect the overall functionality of the notebook. We also feel it’s important to allow for some margin of error. These aren’t unit tests that we expect to pass every time – the user might mistype an input to the notebook, or a data source might be temporarily unreachable. That said, notebooks are supposed to work, so we do want to set a high bar for a notebook to be considered healthy.
Confidence factors
Recency
Because of the potential for code rot over time, a successful execution today is probably a better indication of health than a successful execution a month ago. Each execution log can be weighted to give more importance to recent executions. One possible scheme might give a weight of 1 to today’s executions and gradually decay to a weight of 0 for older executions. For simplicity, we chose to consider only executions within the last 30 days (with equal weight) and ignore older executions.
Repeatability
If a single user executes a notebook only one time, we don’t know if the result will repeatable. If the same user executes it again with the same result, we gain a little confidence in repeatability. However, we get a much bigger confidence boost from additional users – more data from a single user is nice, but the results might depend on something specific to that user. We decided to give each additional user the same weight as 10 executions, defining User-adjusted Executions:
Since each execution log is the result from an individual cell, we use average executions per cell to approximate total notebook executions when computing this for a notebook. (When computing this for a single cell, #cells is 1.)
We then defined a Usage Factor that can be applied to a health score to penalize notebooks or cells that have very few users. The Usage Factor starts at 0.75 for a notebook (or cell) with a single execution and increases to 1.0 with additional users and executions. We wanted the biggest boost to come from gaining a second user, a smaller boost from the third user, and so on, so we chose a logarithmic curve for Usage Factor:
With a single execution per user, then, we have \(UF=0.75\) for 1 user, \(UF=0.92\) for 2 users, \(UF=0.96\) for 3 users, and \(UF=0.99\) for 4 users. We reach “full confidence” when 5 users have executed the notebook.
Cell health
To measure cell health, we simply multiply the success rate by the Usage Factor:
We chose 0.75 as the threshold between “healthy” and “unhealthy.” The choice of number is somewhat arbitrary (mostly used for UI display purposes) but is closely linked with the UF definition. Cells with a low UF need a near-perfect success rate to be considered healthy, while cells with more users and executions have a greater margin for error. In our data, about 90% of executed cells are healthy by this metric (see Figure 6 in the Results section for details).
We considered incorporating runtime into cell health but ultimately chose not to. It would be difficult to correlate health with runtime in a generic and automatic fashion – although perhaps a deviation from normal runtime might indicate a problem. Many notebooks in our system prompt for user input and query external services, both of which can vary wildly in runtime. In addition, we observed a quirk in Jupyter that complicates measuring the runtime – if the user selects “Run All Cells,” then the “begin execution” event fires immediately for all cells even though they run sequentially, causing each cell’s runtime to include that of the previous cell.
Notebook health
As mentioned earlier, users generally execute the cells in a notebook linearly from start to finish. This assumption leads to a few ideas for measuring the health of the notebook itself. In this section, we’ll describe a few of the metrics we came up with as well as how we combined them into a notebook health score.
Notebook metrics
A simple place to start is to consider how many of the notebook’s individual cell executions were successful, or Overall Success Rate:
We can also use the cell health score to define Good Cell Ratio:
We could similarly define Bad Cell Ratio, but note that \(BCR+GCR=1\) does not always hold, because some cells may not have been executed at all (health is unknown/undefined). Figure 2 shows an example of a notebook with low scores for these metrics.
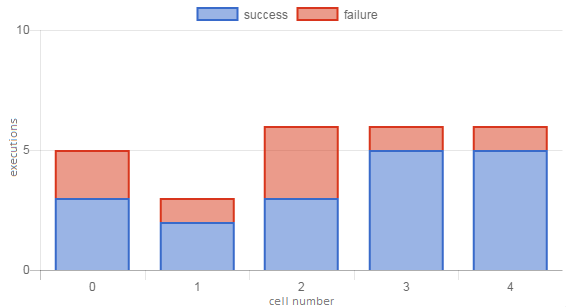
Figure 2. Execution profile of a notebook with poor cell health. The OSR is 0.69, and with only 1 unique user its UF of 0.86 is low enough to bring GCR down to 0 (i.e., all cells are unhealthy).
OSR and GCR capture the overall cell-level health of a notebook. A notebook is intended to be executed as a whole, though, so we’d also like to capture how far users tend to make it through the notebook. Do they breeze all the way through, or are they stonewalled by an early failure? Maybe there are a few bad cells, but they aren’t critical and the user can keep going past them. In Figure 2, for example, it appears the user can make it through the whole notebook despite the somewhat unhealthy cells.
One method we devised to assess notebook-level health is to use the cell health score to calculate First Bad Cell (lowest-numbered unhealthy cell) and Last Good Cell (highest-numbered healthy cell), each a fraction from 0 to 1:
We number cells starting from 0, so the extra +1 in the LGC formula is to align the two values. A notebook with a single good cell followed by a single bad cell will have \(FBC=LGC=0.5\), and notebook with all good cells will have \(FBC=LGC=1.0\). A notebook with a non-critical error in an early cell might have a relatively small FBC but still have LGC near 1, while a notebook with a fatal error might have small values for both since users can’t make it to the end of the notebook.
Another method to evaluate notebook health is to consider individual user “sessions” of running the notebook and see in which cell, on average, users encounter their first error and last success. Each time a user runs the notebook, we can track the first (lowest-numbered) cell that fails and the last (highest-numbered) cell that succeeds, with appropriate defaults if there are no failures or no successes. (In practice, it can be difficult to accurately separate all of a user’s sessions in the execution log data – a user might re-execute some cells or take a lunch break in the middle of the notebook. We approximate sessions by grouping the logs by day; that is, the set of logs for each unique (user, notebook, day) tuple is assumed to be a single session.) We average these values across all user sessions to compute First Failure Depth and Notebook Execution Depth:
As with LGC, the extra +1 aligns the two values such that, for example, a perfect notebook has \(FFD=NED=1\). FFD and NED are very similar to FBC and LGC, respectively, and we expect that the scores will be correlated – for example, it is likely that users will tend to encounter their first failure (FFD) in the lowest-numbered unhealthy cell (FBC). Figures 3 and 4 show some examples of these notebook-level metrics.
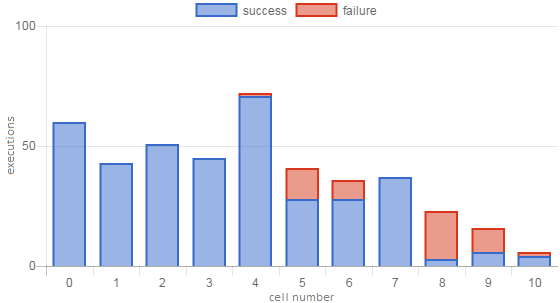
Figure 3. Execution profile of a notebook with low execution depth. OSR is fairly good (0.87), but failures in later cells bring the NED score down to 0.62 and GCR to 0.63.
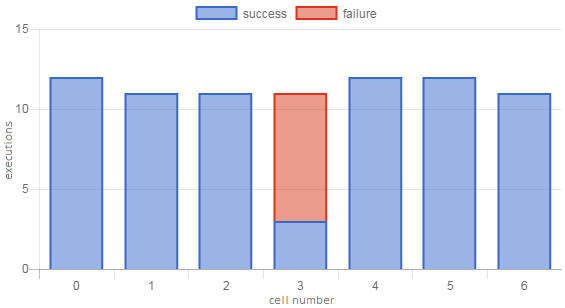
Figure 4. Execution profile of a notebook with a non-fatal error in the middle of the notebook. OSR (0.90) and NED (1.0) scores are high, while FFD (0.61) and FBC (0.42) scores are low.
Health score
We’ve described 6 notebook health metrics, each of which ranges from 0 (unhealthy) to 1 (healthy). We expect that some of them will be well correlated – in fact, in some scenarios all 6 will have the same value – but there are some interesting three-way relationships, as well. For example, a notebook with high Good Cell Ratio will usually have a high Overall Success Rate (unless unhealthy cells have a much higher execution count), but the reverse is not true if users don’t make it to the end of the notebook for some reason (low Notebook Execution Depth, as in Figure 3).
Recall that for a notebook health score, we wanted to account for how far users make it into the notebook, overall cell health, and our confidence factors. We preferred to avoid the metrics that rely on the arbitrary 0.75 cell health threshold. We felt that Notebook Execution Depth best represented how far users make it into the notebook – First Failure Depth doesn’t account for whether an error is recoverable (as in Figure 4, for example), and it’s less resistant to a user’s misconfigured environment or other fluke failures. For cell health, we went with Overall Success Rate over Good Cell Ratio because (as alluded to above) GCR turns out to correlate well with NED, while OSR and NED complement each other with respect to some of the challenges we’ll discuss below. Lastly, for the confidence factors, we used the Usage Factor computed across the notebook. Bringing it all together, we defined notebook health:
This score also ranges from 0 (unhealthy) to 1 (healthy). More specifically, though, a notebook’s health score cannot exceed its Usage Factor. This is intentional – as with cell health, we want a notebook to be near-perfect to be considered healthy until it has more users and executions. For notebooks, we defined the score range [0.625, 1] to be “healthy” and the range [0, 0.375] to be “unhealthy,” with the gap in the middle considered “undetermined.” As with the 0.75 cell health threshold, these ranges are mostly arbitrary and are used mainly for display in the nbgallery UI. In our corpus of notebooks, about 65% are healthy, 9% are unhealthy, and 26% fall in the undetermined range (see Figure 7 in the Results section for more detail).
Challenges and limitations
Intentionally failing cells
Many education and training notebooks have cells that fail by design, perhaps to demonstrate some kind of error or exception handling. Cells that always fail will obviously reduce the Overall Success Rate, but Notebook Execution Depth should be mostly immune. We anticipate that such cells are relatively rare and therefore unlikely to flip a notebook from healthy to unhealthy.
Optional cells
Notebook Execution Depth relies on the assumption that notebooks are intended to run sequentially, but we have a few cases of what we call “choose your own adventure” notebooks. In most cases, these are just a handful of optional cells at the end of a notebook that allow the user to format data in different ways or enrich results with some external data source. In more extreme cases (Figure 5), large sections of the notebook might be optional. We hope that Overall Success Rate will help compensate for the effect on Notebook Execution Depth such that optional cells will not often drag a notebook down into unhealthy territory.
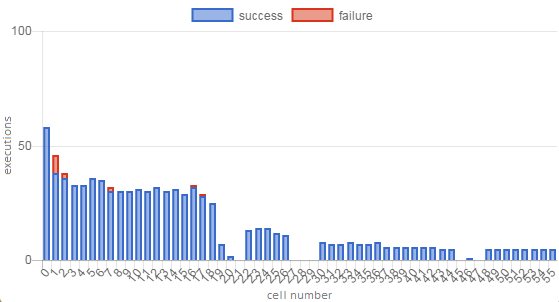
Figure 5. Execution profile of a notebook with many optional cells. This is an educational notebook with core material at the beginning followed by several optional sections. The three 3-cell gaps are empty cells added to the notebook as placeholders for users to insert their own solutions to exercises, so most users did not run them as-is. This notebook has a low NED score (0.40) due to the optional cells, but its OSR (0.98) is very high, resulting in a low but healthy overall score of 0.69.
Notebook updates
It’s not clear how best to handle updates to a notebook. Currently, we clear all the execution logs and reset the health status when the author updates a notebook. In some ways, this is the right answer anyway — an update might break a healthy notebook just as easily as it might fix an unhealthy one. We did implement a minimal solution here by storing the previous health score when a notebook is updated. Then, for a few days while we gather execution data for the new version, we can display something in the UI like “health undetermined but previously healthy.” We use health scores to boost search results, so this gives strong notebooks a grace period to restore their score before dropping in the results.
Modification during execution
After launching a notebook from nbgallery, the user might modify some of the cells before executing them. Some notebooks may even require this if the user needs to specify parameters in code instead of being prompted with some sort of input widget. Unfortunately, this creates gaps in the execution data because nbgallery discards execution logs if the code hash doesn’t match a known cell. Our current health formula is mostly immune to this as long as such cells are rare, but other approaches to health scoring may need to account for it.
Results
In a recent snapshot of our data, we have 521 notebooks (about a quarter of the total corpus) with execution logs within the last 30 days. These notebooks contain a total of 7827 cells, of which 5254 (67%) have execution records.
About 90% of cells are considered healthy (Figure 6), and 84% have a perfect success record. A large number of cells (36%) have only a single execution. Most of those were successful, resulting in a spike in the distribution at 0.75, the minimum healthy score.
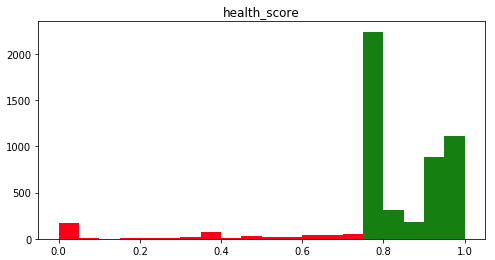
Figure 6. Distribution of cell health scores in our corpus of notebooks.
Of the 521 notebooks, 340 (65%) are healthy, 45 (9%) are unhealthy, and 136 (26%) fall in the undetermined range (Figure 7). This distribution is basically what we were hoping for – in a collaborative environment like ours, we expect that most notebooks will be healthy, with relatively few at the low end of the spectrum. As with cells, a large number of notebooks (188, or 36%) have the minimum Usage Factor of 0.75, meaning a single user with 1 execution per cell or less. Of those 188 notebooks, 41 have OSR and NED of 1.0, resulting in a spike in the health score distribution at 0.75.
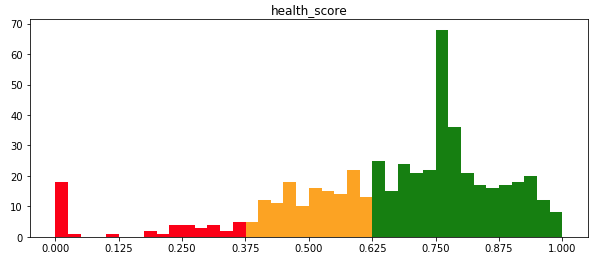
Figure 7. Distribution of notebook health scores in our corpus.
Table 1 shows the correlation matrix of the 6 notebook health metrics. The highest correlations, as expected, are between scores with co-dependencies such as Good Cell Ratio and Last Good Cell, First Failure Depth and First Bad Cell, and Notebook Execution Depth and Last Good Cell.
| OSR | GCR | FBC | LGC | FFD | NED | |
|---|---|---|---|---|---|---|
| OSR | 1.00 | 0.54 | 0.58 | 0.55 | 0.68 | 0.51 |
| GCR | 0.54 | 1.00 | 0.29 | 0.88 | 0.35 | 0.75 |
| FBC | 0.58 | 0.29 | 1.00 | 0.20 | 0.87 | 0.30 |
| LGC | 0.55 | 0.88 | 0.20 | 1.00 | 0.30 | 0.82 |
| FFD | 0.68 | 0.35 | 0.87 | 0.30 | 1.00 | 0.33 |
| NED | 0.51 | 0.75 | 0.30 | 0.82 | 0.33 | 1.00 |
Figure 8 shows each of the 6 notebook health metrics plotted against each other, along with the distribution of each. Note that several of the plots have a stripe along the line \(x=y\). This is another effect of the many notebooks with only one execution, where it is more likely for various metrics to have the same value. For example, with a single execution for every cell, each successful execution results in a good health score for that cell, so GCR and OSR will be equal. If we remove the notebooks with UF of 0.75, the \(x=y\) stripes are less prevalent but still noticeable; for example, it appears somewhat common for FBC and LGC to be equal, perhaps due to a fatal cell failure that users can’t get past.
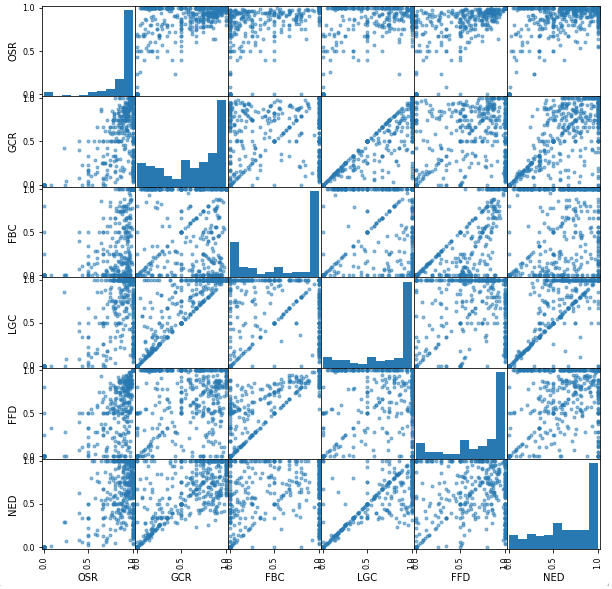
Figure 8. Distributions and relationships of the 6 notebook health metrics.
Potential future work
Static code metrics
As mentioned in the survey of related topics, static metrics merely indicate a risk for unhealthy code, but we are still interested in them from a couple other angles.
First, we might be able to apply methodology from defect prediction studies to assess the potential health of notebooks for which we have no execution logs. The nbgallery UI might then indicate something like “health unknown but looks good.” As a simple experiment, we saw no correlation between lines of code and health score in our data, but more sophisticated metrics (perhaps at the cell level instead of notebook level) might reveal trends.
Second, our community of Jupyter users emphasizes collaboration and using notebooks as training tools. We’ve received a few comments about an increasing number of “ugly” notebooks – lots of code in a single cell, no explanatory documentation cells, etc. Perhaps static metrics could be used to build a “style” score that would encourage authors to make notebooks more readable.
Notebook updates
As mentioned earlier, we implemented a simple solution to retain a notebook’s previous health score after an update. However, execution logs from the old version are still purged when the notebook is updated. If we know that a notebook update is minor, we could potentially preserve the execution data and simply update the code hashes in the database instead of recreating the cell entries. We could determine that an update is minor by prompting the author, or perhaps automatically based on number of cells modified or diffs of the code.
Intentionally failing and optional cells
Jupyter allows the user to add arbitrary metadata to a cell, and the latest version introduces a cell tagging feature. Notebook authors could use these to indicate cells that always fail or might not be executed. The health computations could then be adjusted to account for such cells; for example, Overall Success Rate might ignore always-failing cells while Notebook Execution Depth might ignore optional cells.
Confidence factors
For simplicity, we only considered executions from the last 30 days, and as a result only about a quarter of our notebooks qualified for a health score. Going back 60 days would only bring in another 10% of our notebooks, so other measures of recency might be more effective. We may want to go back even further but give more weight to more recent executions. (Note, though, that a different recency strategy may affect the formulas for other metrics.) Another variation in the confidence factors might be to incorporate user-specific weights into the Usage Factor. For example, notebook authors might accidentally encode assumptions about their environment, so it might count for less when they execute their own notebooks.
Definition of execution success
We defined cell execution success to be “exception-free” because that information is immediately available in Jupyter and because our data security rules make it difficult to log any additional details. Exception-free is a very rough definition of success, and other environments may certainly have better indicators. A cell that queries a remote REST API could use the HTTP return code to determine success, and runtime might be a good indicator for a complex computation. The challenge lies in making these determinations in a generic and automatic fashion. Cell metadata could be used here as well, but it may not be desirable to place the burden on notebook authors to define success for every cell.
Conclusion
We believe this is one of the first thorough studies of code health with a focus on user-developed code in a collaborative, dynamic environment where formal software testing methods are not feasible. In such systems, measuring and displaying code health can improve users’ productivity as well as their confidence in the system. In nbgallery, code health is factored into recommendations and search result rankings to guide users toward known-good notebooks, and we can envision other applications like identifying power users or automatically disabling code when it stops working. We hope this work will motivate others to apply similar ideas to other systems that support code developed by their users.